Learn the ins and outs of the relationship between an Agent and a Loan Originator in Market Insights.
What's covered?
1. Viewing the Buying or Listing Agents when viewing Loan Originators in search results.
2. Viewing the Buying or Listing Agents from an Originators Volume Report
3. Understanding the metrics on the relationship chart
4. Sorting, Filtering and Searching the Top Agents Chart
🛑 You will need access to Realtor data to view Agent and Originator Relationships in Market Insights. We recommend reaching out to support@modelmatch.com to learn how you can obtain access to Realtor data. 🛑
Viewing an Originators Buying or Listing Agents (Search Results)
When searching for Originators in Market Insights you can quickly view agents on the Buyer Side, Listing Side or Dual Agency side directly in the search results.
1. Let's run a search in a Market so we have results to look at.
2. When we have identified an originator and want to view a list of the agents they have worked with on the Buying side of transactions, click on the "Options" icon on their "card" and select "View Buyer Agents"
3. You will now be viewing a list of each agents that represented the Buyer on transactions with this Loan Originator. Let's take a closer look at the information we are seeing:

✅ "B" indicates this is a Buyer Agent. ("L" for Listing and :"D" for Dual Agency)
✅ "Total" shows us the Agent's Total Volume and Unit Count
✅ The next line shows us the Total Volume and Percentage of Volume with the Originator
✅ "All Others" shows us the Total Volume and Percentage of Volume with all other Originators
Alternatively, we can now target an Agent from our results and view a list of all other Originators they are also conducting business with.
4. Using the "Options" icon on the Agents results card, let's click "View Originators"
5. You will now be viewing a list of all of the Originators that was involved in transactions with this Agent. Let's take a closer look at the information we are seeing:
Viewing the Buying or Listing Agents from an Originators Volume Report
We can also view Agents and Loan Originator relationships from Volume Reports in Market Insights.
1. Let's start by opening the volume report for an Originator by clicking "View Details" from the options icon.
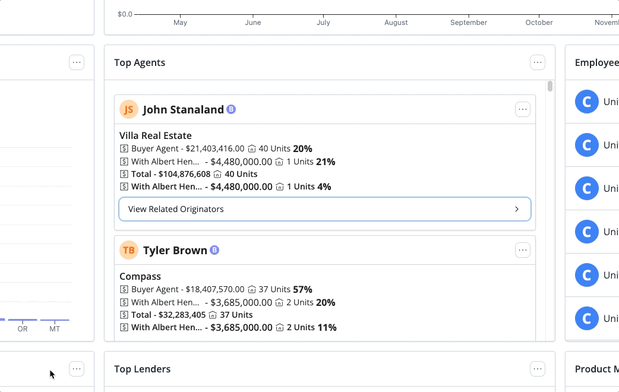
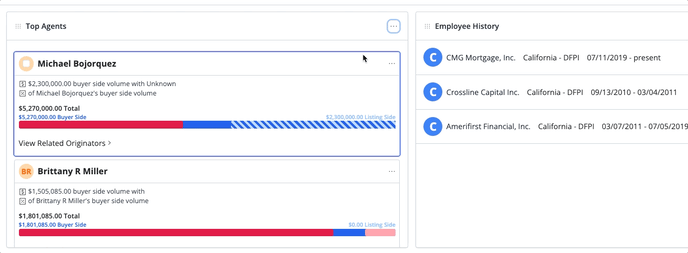
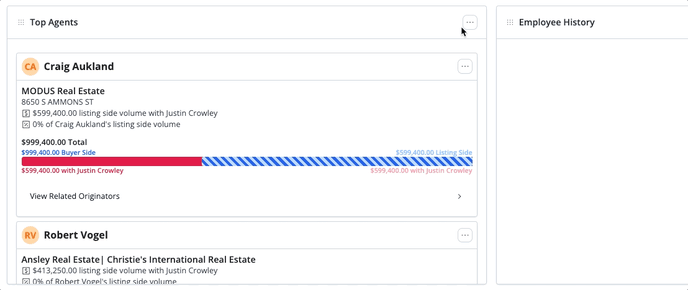
2. Let's focus our attention on the "Top Agents" chart. This is where we are able to view all of the Agents that this Originator has conducted business with. We can select the "Options" icon here to narrow this list down to just Listing, Buyer, or All Agents.
3. Each Agent card in this table allows us to also view a list of other Originators that an Agent has worked with. Let's click on "View Related Originators" from the Agent's card.
This list will show us every originator that this Agent has worked with along with their % of shared volume.
Understanding the metrics
There are a number of different metric items that you'll see when viewing the relationships of an Agent or the relationships of a Loan Officer. Let's take a look at a few examples so we can understand these metrics a bit better.
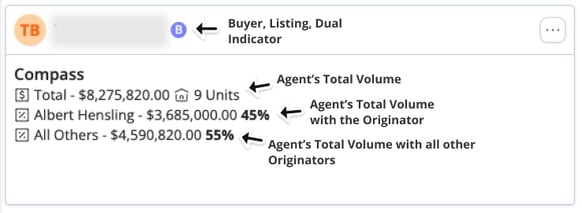
1. When viewing the Agents that a Loan Officer has worked with on either the Buying, Listing or Dual Agency side of transactions in your search results, you'll find this view on each Agent's profile card.
This card is showing you a number of metrics:
✅ If this agent represented the Buyer, Seller (Listing) or Both (Dual Agency)
✅ The Agents Total Volume
✅ The Agent's Total Volume with this specific Originator
✅ The Agent's Total Volume with with all other originators
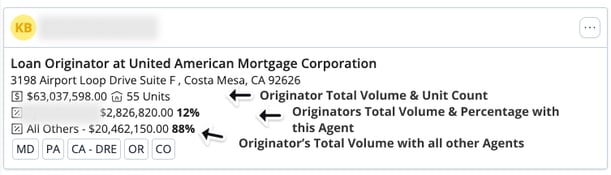
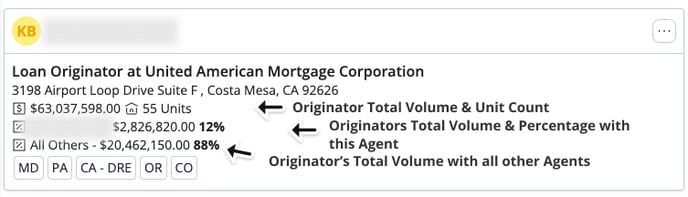
2. When viewing the Loan Officers that an Agent has worked with on either the Buying, Listing or Dual Agency side of transactions in your search results, you'll find this view on each Originator's Profile Card.
This card is showing you a number of metrics:
✅ The Total Volume and Unit Count for this specific Originator
✅ The Originator's Total Volume & Percentage with this specific Agent
✅ The Originator's Total Volume with all other agents
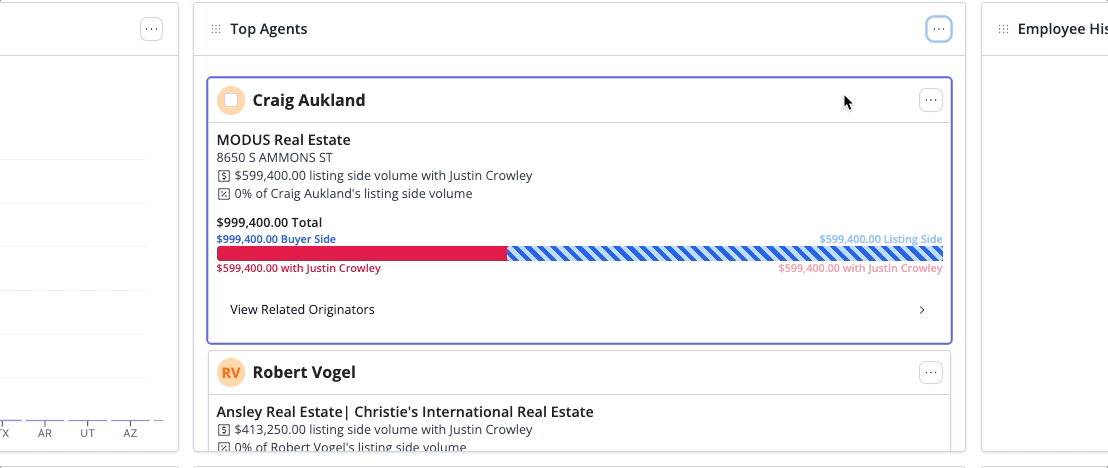
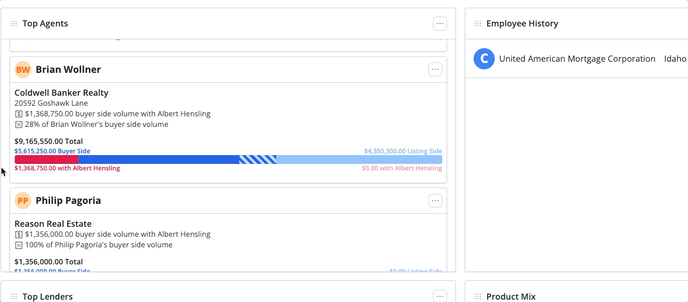
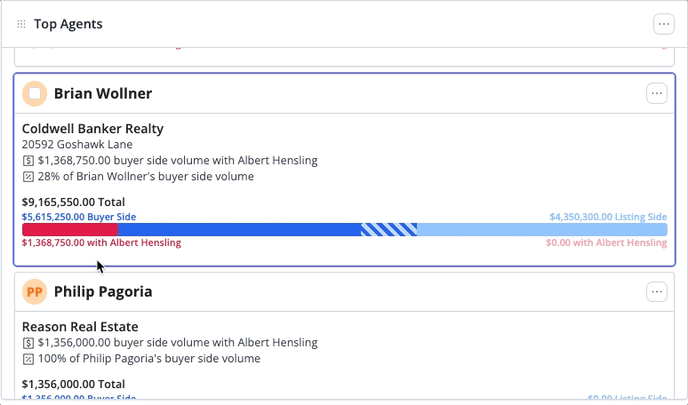
3. When viewing an Originator's Agent relationships from their Volume Report, you will see metrics that are narrowed down to the type of Relationship: Buying, Listing or Dual.
This card is showing you a number of metrics depending on the Relationship (Buyer, Listing or Dual)
✅ The Total Volume with the Originator
✅ Percentage of Agent's Volume this Originator has captured
✅ Agent's Total Volume
✅ Agent's Total Buyer side volume (Dark Blue Shade)
✅ Agent's Total Buyer volume with the Originator (Red Shade)
✅ Agent's Total Listing volume (Light Blue Shade)
✅ Total Dual transactions (striped)
You can hover over each area of the graph to view additional metrics like Units and Percentage.
Sorting, Searching and Filtering the Top Agents Chart
You are also able to Sort, Filter and Search within the Top Agents chart. Let's take a look at each of these options.
1. Sorting
You have the option to sort by the following:
👉 Volume
👉 Units
👉 Percent of Volume
Simply click the Options under the Chart Settings menu and select "Sort By" to view your options.
2. Filtering
By default, the Top Agents chart will show the Top Agents on the Buyer side of transactions with the Originator. You can also view Listing Agents or All Agents.
You have the option to filter the Top Agents list by the following:
👉 Buyer Agents
👉 Listing Agents
👉 All Agents
3. Search This List
You can also search within the Top Agents table using the "Search List" option under "Options"